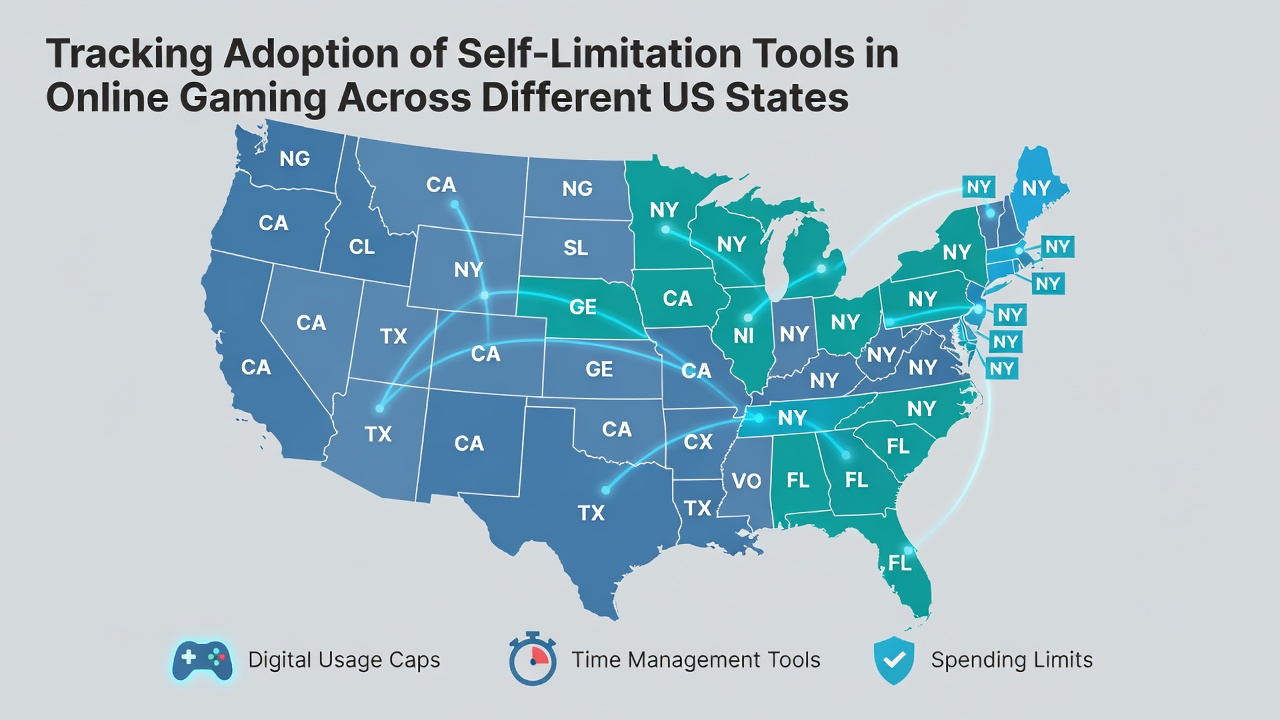
Tracking Adoption of Self-Limitation Tools in Online Gaming Across Different US States
Data from state regulatory bodies shows that self-limitation tools such as deposit caps, session timers, and temporary exclusions have seen varying uptake in regulated online gaming markets since their introduction, and this pattern holds steady into August 2026 as more operators integrate these features across platforms. New Jersey's Division of Gaming Enforcement tracks player participation through mandatory reporting, revealing that deposit limit selections rose from 12 percent of active accounts in 2023 to 19 percent by mid-2026 while time-based limits followed a similar climb in the same period.
State-by-State Adoption Patterns
Pennsylvania's gaming control board compiles monthly figures that indicate self-exclusion enrollments reached 8,400 accounts by August 2026, a figure that outpaces Michigan's reported 5,200 in the same timeframe even though both states launched online offerings around comparable dates. Observers note that Michigan's tools emphasize voluntary spending reminders sent via app notifications, whereas Pennsylvania requires operators to offer combined deposit and loss limits at signup, and these structural differences appear in the data collected from each jurisdiction.
Delaware and West Virginia maintain smaller online markets yet document adoption through annual summaries released by their respective lottery and racing commissions, and researchers cross-reference these with player retention metrics to identify correlations between tool availability and account longevity. One study from a Midwest university examined data sets from these states alongside larger markets and found that players who activated at least one limit maintained average session durations 22 percent shorter than those who did not.
Factors Influencing Uptake Rates
Regulatory mandates play a central role in tool visibility, with states requiring prominent placement on operator dashboards reporting higher initial engagement than those relying on optional menus, according to compliance reviews conducted through 2025 and into 2026. Industry associations such as the American Gaming Association publish comparative overviews that highlight how marketing of responsible gaming resources varies, and states with dedicated public awareness campaigns show steadier month-over-month increases in limit activations.
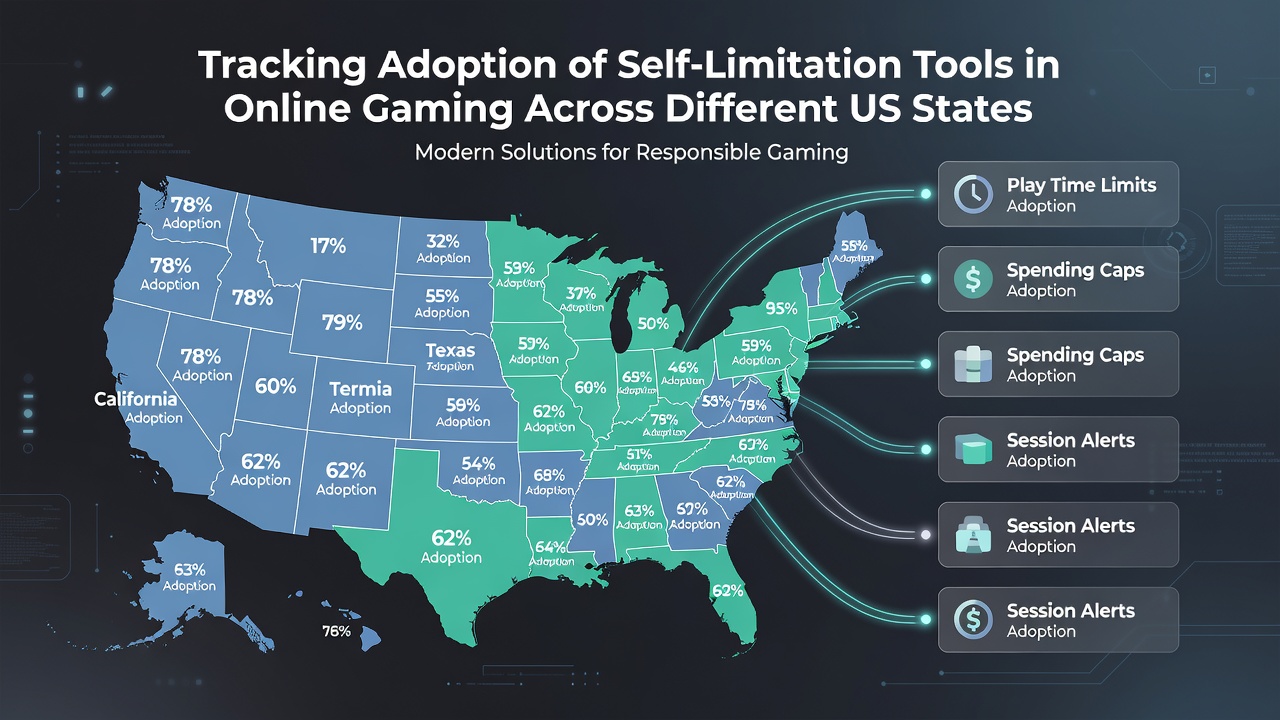
Payment method integration also surfaces in analyses from academic sources, where researchers at a Canadian institution reviewed transaction logs and discovered that players using digital wallets activated spending caps more frequently than those relying on credit cards across multiple US jurisdictions. This pattern emerged consistently in datasets spanning 2024 through August 2026, suggesting platform design influences behavior independently of state borders.
Data Collection and Reporting Methods
State agencies collect information through operator-submitted APIs that log limit selections without identifying individual accounts, and this aggregated approach allows for cross-state comparisons while preserving privacy standards. The National Council on Problem Gambling maintains a repository of these anonymized summaries and collaborates with university teams to standardize metrics, enabling analysts to track trends such as the rise in multi-tool usage where players combine deposit caps with reality checks.
August 2026 updates from several commissions include breakdowns by age group and game type, showing that slot and table game participants in New Jersey selected time limits at rates nearly double those observed among sports bettors in the same market. Similar granular reporting from Pennsylvania reveals modest but consistent growth in exclusion requests following promotional periods, a detail captured in quarterly filings available through public portals.
Conclusion
Across regulated US markets the adoption of self-limitation tools continues to expand through a combination of regulatory requirements, operator implementation, and player choice, with state-specific data providing measurable benchmarks for ongoing evaluation. Figures compiled through August 2026 demonstrate measurable differences in uptake tied to policy design and platform features, while collaborative research efforts supply additional context on usage patterns that span multiple jurisdictions.