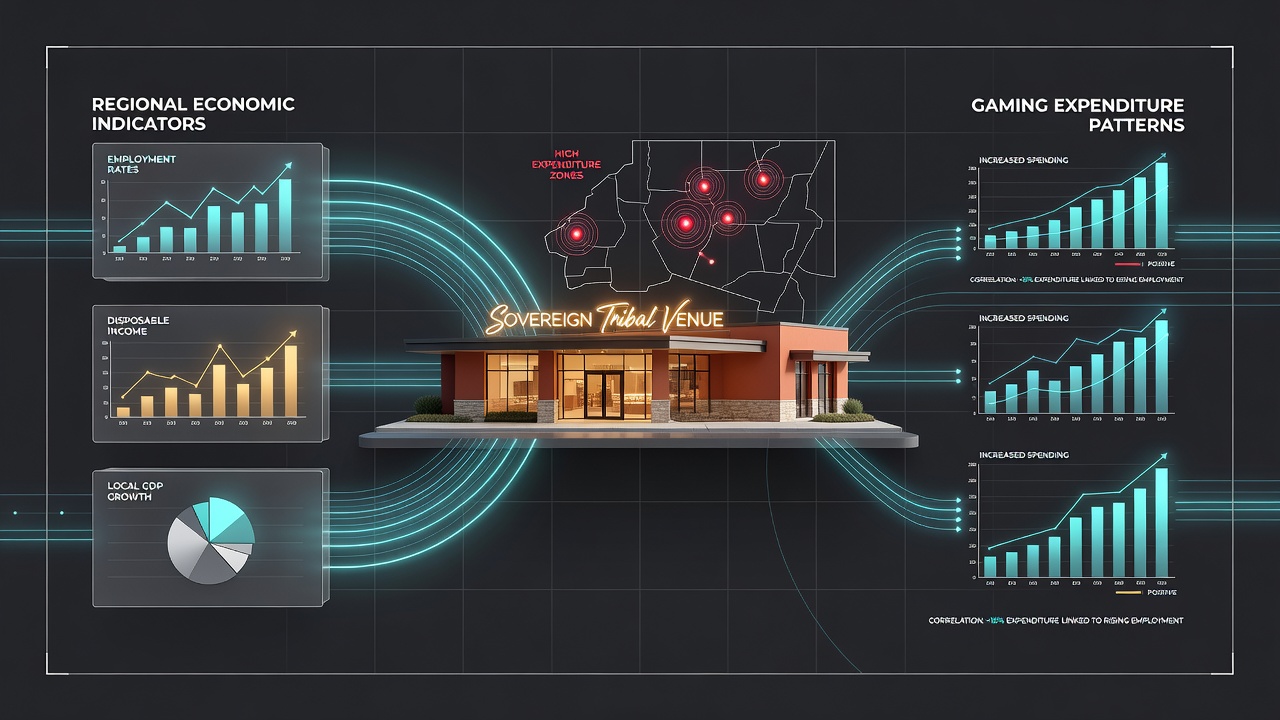
Tracing how regional economic indicators influence gaming expenditure patterns at sovereign tribal venues
Regional economic indicators such as unemployment rates, median household income, and tourism inflows shape spending behaviors at sovereign tribal gaming venues across multiple states. Observers note that these factors create measurable shifts in player volume and per-session expenditures when local economies experience fluctuations, particularly in areas where tribal casinos serve as primary entertainment destinations for surrounding communities.
Unemployment Trends and Visitor Frequency
Data from the Bureau of Labor Statistics shows that rises in county-level unemployment often coincide with reduced visit frequency at nearby tribal properties, yet average wager amounts per visit sometimes hold steady among remaining patrons. Researchers tracking venues in the Midwest and Southwest have documented how job losses in manufacturing and agriculture sectors lead to shorter session lengths during downturns, while recovery periods bring gradual rebounds in both attendance and total handle. In June 2026 several tribal operations reported that unemployment stabilization in adjacent counties correlated with steadier weekday traffic compared to the volatility seen earlier in the year.
Income Levels and Game Preference Shifts
Median household income data released by the U.S. Census Bureau reveals connections between regional earnings and preferences for slot denominations or table minimums at tribal facilities. Higher-income zip codes tend to generate more play on higher-denomination machines and premium table games, whereas areas with stagnant wages show stronger volume on penny and nickel slots. Analysts examining loyalty program records across Oklahoma and California tribal casinos found that income dips in energy-producing regions prompted measurable migration toward lower-stakes options without an overall drop in total player count.
Tourism Metrics and Seasonal Expenditure Patterns
Tourism arrival statistics from state visitor bureaus demonstrate how hotel occupancy rates and highway traffic volumes influence weekend and holiday spending surges at tribal resorts. When regional tourism strengthens, properties located near major travel corridors record increases in both drop and win, particularly in restaurants and non-gaming amenities that complement the gaming floor. Conversely, disruptions such as fuel price spikes or weather-related travel reductions produce immediate compression in these same metrics, with effects most pronounced at venues that draw day-trippers rather than overnight guests.
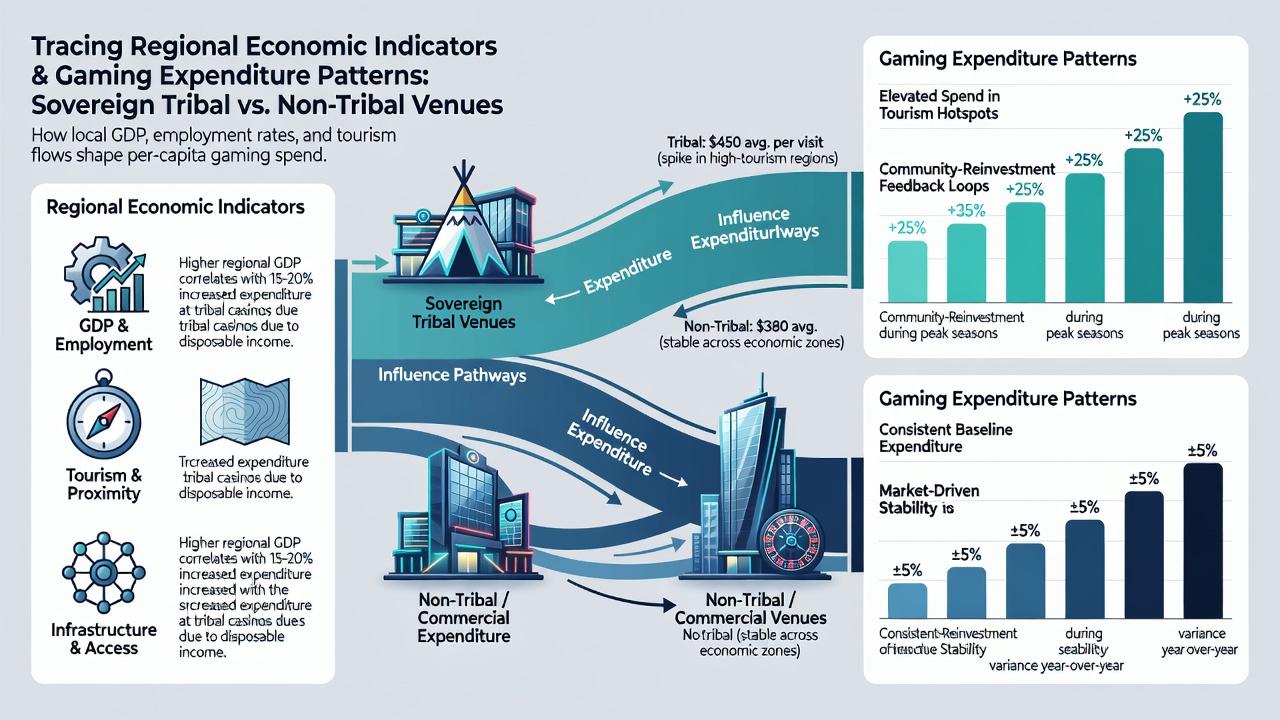
Those who monitor multi-property tribal networks have observed that facilities in high-tourism corridors maintain more consistent expenditure levels even during broader economic softness, because visitor flows from outside the immediate region offset local income declines. June 2026 figures indicated that tribal venues near national parks and scenic routes posted stronger recovery in table game drop than properties reliant solely on local drive-up traffic.
Cross-Indicator Correlations in Practice
Studies compiled by the National Indian Gaming Commission illustrate how combinations of indicators produce compounded effects on gaming expenditure. When unemployment rises alongside falling tourism numbers, total revenue can contract faster than either factor alone would suggest. In contrast, strong local income growth paired with rising visitor arrivals often generates outsized gains in high-limit play areas. Analysts reviewing monthly reports from tribal governments note that these interactions vary by jurisdiction, with rural properties showing greater sensitivity to agricultural employment data while urban-edge casinos respond more directly to metropolitan wage trends.
Payment and Loyalty Data as Supporting Evidence
Payment platform transaction logs and loyalty card redemptions provide granular views of how economic signals translate into real-time behavior. Researchers comparing datasets across multiple states have identified that debit card usage spikes during periods of local economic uncertainty, while credit card volume and marker play increase when regional indicators point upward. These patterns help operators adjust marketing calendars and promotional structures without relying on anecdotal floor observations.
Conclusion
Regional economic indicators continue to serve as reliable predictors of expenditure patterns at sovereign tribal venues, with unemployment, income, and tourism data offering measurable signals that operators monitor through aggregated reports and loyalty analytics. As of June 2026, ongoing tracking by tribal regulatory bodies and academic partners shows these relationships remain consistent across diverse geographic markets, allowing properties to anticipate shifts in player volume and session value based on publicly available economic releases.