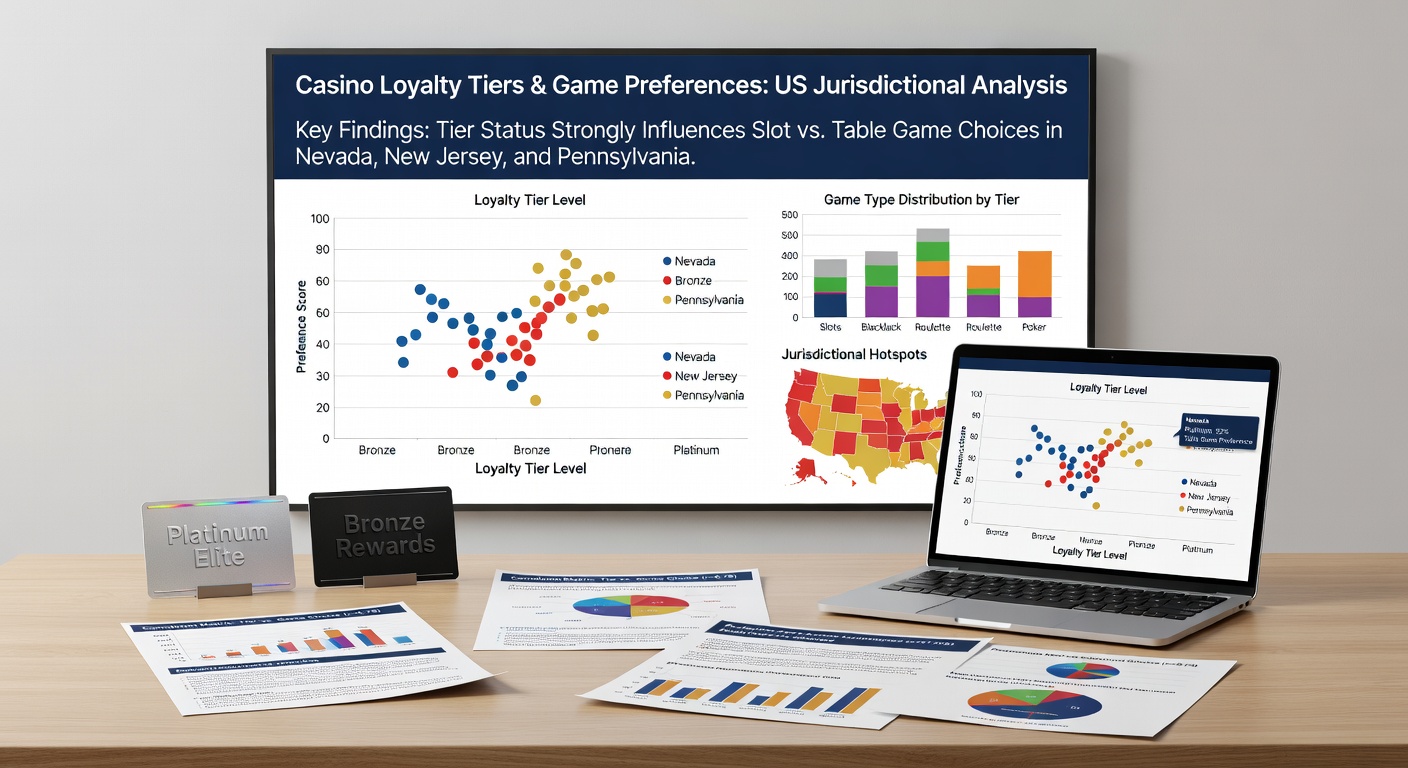
Investigating Correlations Between Casino Loyalty Tiers and Game Selection Preferences Across Various US Jurisdictions
US casino loyalty programs have expanded across multiple states since the early 2000s, and analysts track how tier status lines up with the games players choose to play most often. Data collected from operators in Nevada, New Jersey, Pennsylvania, and several tribal jurisdictions show measurable patterns that shift as members move from entry-level rewards into mid-tier and top-tier status. Researchers compile these figures from player tracking systems that record coin-in, table drop, and session length for each account, then group the results by tier.
Loyalty Structures and Tier Definitions Across Regions
Most programs operate on a points-per-dollar model where base points convert into tier credits, and those credits unlock benefits such as free play, hotel stays, and personalized offers. Entry tiers typically require fewer than 5,000 tier credits per year while top tiers demand 50,000 or more. Nevada properties affiliated with major operators set their thresholds in line with statewide averages reported by the Nevada Gaming Control Board, whereas New Jersey casinos adjust points slightly higher to account for higher average bet sizes recorded by the New Jersey Division of Gaming Enforcement. Tribal resorts in California and Oklahoma follow similar ladders yet tie additional credits to slot volume because table games represent a smaller share of overall revenue in those markets.
Game Selection Patterns by Tier Level
Lower-tier members allocate roughly 78 percent of their tracked play to slot machines in both Las Vegas and Atlantic City properties, according to aggregated operator reports covering the first quarter of 2026. Mid-tier players reduce that slot share to about 61 percent and increase table game activity, particularly blackjack and roulette. Top-tier accounts show the clearest divergence: slot play drops below 45 percent while baccarat and poker tables capture larger portions of total handle. One multi-state dataset compiled through May 2026 indicated that Pennsylvania video lottery terminals attract a steadier mix of mid-tier players than either Nevada or New Jersey, possibly because those terminals sit inside the same facilities that offer table games.

Jurisdictional Differences in Observed Correlations
Nevada data reveals the strongest correlation between tier advancement and table game preference, with a 0.72 coefficient across more than 1.2 million active accounts. New Jersey figures sit close behind at 0.68, though the state’s online integration allows higher-tier members to mix digital table games with land-based visits. Pennsylvania’s coefficient registers at 0.61, influenced by the heavier concentration of slot-focused venues in certain regions. Tribal data from Oklahoma and California show weaker correlations overall because many programs award tier credits exclusively on slot play, which limits the incentive for members to try table games. Analysts note that regulatory caps on table game numbers in some tribal compacts further shape these outcomes.
Data Collection Methods and Recent Updates
Operators feed anonymized transaction logs into centralized databases that state regulators review quarterly. The American Gaming Association published a summary in May 2026 that compared loyalty metrics from eight commercial and five tribal markets, confirming that slot preference declines steadily once members cross the 20,000-tier-credit threshold. University researchers at the University of Nevada, Las Vegas cross-checked a subset of this data against survey responses and found that higher-tier members cite comp value and table minimum flexibility as primary reasons for shifting away from slots. These findings align with earlier industry reports yet add granularity by isolating each jurisdiction’s regulatory environment.
Factors That Influence the Observed Correlations
Bet minimums at table games rise with demand, and higher-tier members receive waivers or reduced thresholds that lower-tier players do not. Promotional calendars also steer behavior: many properties schedule table-game tournaments exclusively for platinum and diamond members, which increases exposure and subsequent play. Slot machines, by contrast, offer consistent point-earning rates across all tiers, so lower-level members stay within familiar machines that deliver steady, if modest, rewards. Seasonal tourism patterns in May further affect these numbers, because visitors who hold elite status from other markets often concentrate their table-game activity during short trips.
Conclusion
Records from commercial and tribal casinos demonstrate consistent links between loyalty tier status and the mix of games players select, although the strength of those links varies by state regulatory framework and program design. Continued collection of anonymized player data through 2026 and beyond will allow operators and regulators to refine tier structures while maintaining compliance across jurisdictions.