Decoding Payment Flow Patterns Across Multi-State Casino Networks and Their Ties to Session Durations
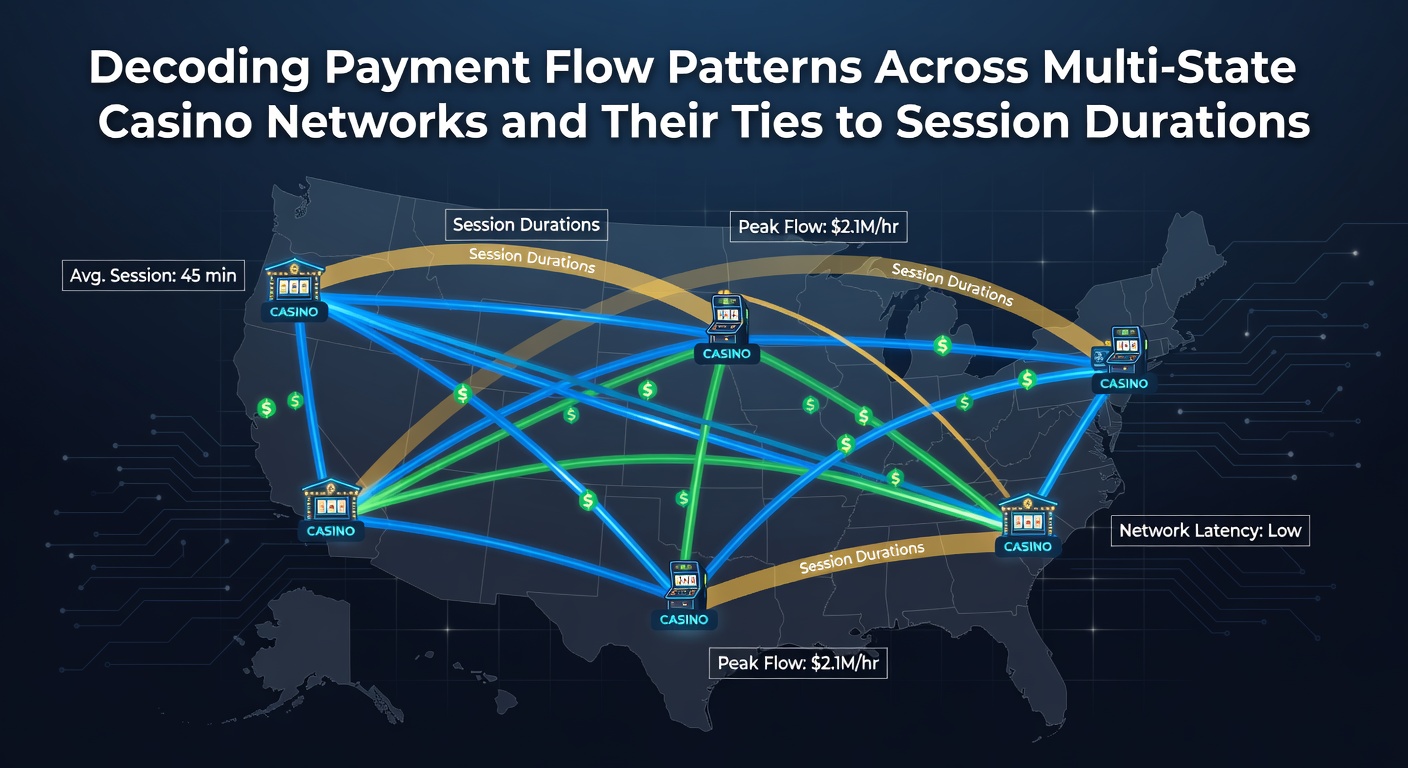
Payment systems in multi-state casino operations move funds through deposits, in-game wagers, and withdrawals that often cross regulatory boundaries between states like New Jersey, Pennsylvania, and Michigan. Observers note these flows create traceable patterns because each transaction carries timestamps, player identifiers, and jurisdictional markers that link directly to how long individual gaming sessions last. Data from regulated markets shows average session durations vary when payment methods change, with credit card deposits often correlating to shorter bursts of play while e-wallet transfers extend engagement windows by several minutes on average.
Mapping Transaction Pathways in Networked Casino Systems
Multi-state operators maintain centralized ledgers that record every payment movement regardless of the physical location where play occurs. These records capture the sequence from initial deposit through repeated wagers and eventual cash-out, revealing clusters of activity that researchers associate with particular session lengths. Studies of loyalty program data indicate that players who complete three or more payment actions within a single hour tend to maintain sessions between 45 and 90 minutes, whereas single-transaction users frequently exit within 30 minutes. Payment processors route funds differently depending on state-specific rules, which affects both speed and visibility of these flows. In jurisdictions that permit instant withdrawals, the time between final wager and cash-out shortens noticeably, and analysts have documented corresponding reductions in overall session duration by up to 15 percent compared with states requiring manual review periods.
Linking Payment Timing to Measured Session Lengths
Session duration tracking relies on continuous monitoring of account activity rather than physical presence at a machine or table. When a deposit arrives, the clock starts; when the balance reaches zero or a withdrawal processes, the session ends. Figures from integrated casino management platforms reveal that deposit methods requiring multi-factor authentication extend the gap between login and first wager, yet once play begins these users often sustain longer continuous sessions than those using stored payment profiles. Researchers examining anonymized transaction logs across several operators found that weekend payment spikes align with extended evening sessions, while weekday morning deposits more frequently precede brief 20-minute engagements. The same datasets show mobile-initiated payments produce tighter clustering of transactions within sessions, reducing idle time between wagers compared with desktop-based funding.
Regulatory Data and Cross-Border Comparisons
State gaming agencies compile monthly reports that include aggregate payment volumes and session statistics, allowing analysts to identify trends without accessing individual player records. According to information released by the
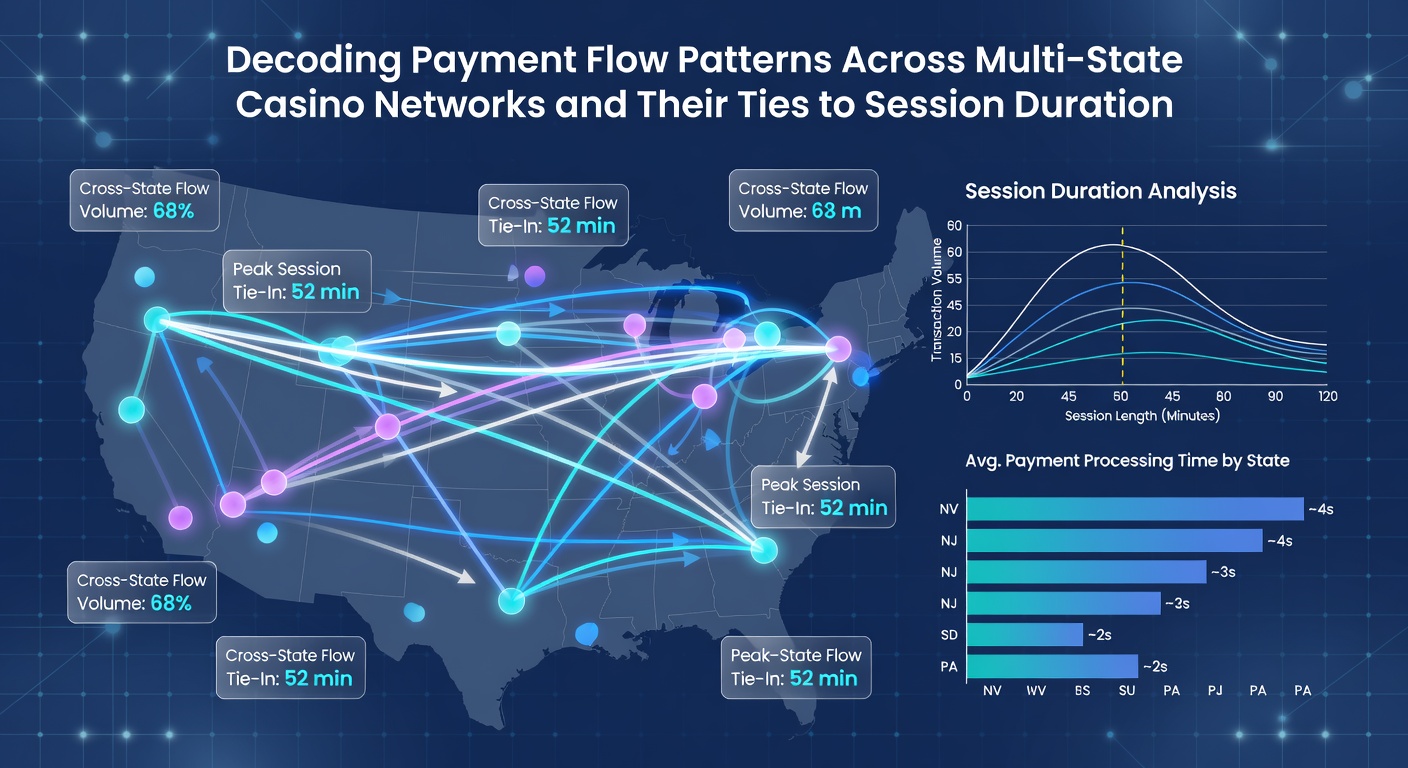
New Jersey Division of Gaming Enforcement, total handle processed through digital wallets rose steadily through spring 2026, coinciding with measurable increases in sessions exceeding one hour. Similar patterns appear in Pennsylvania records, where operators report that players using bank transfers complete fewer but longer sessions than credit users. Cross-state comparisons become possible because major operators share backend infrastructure, enabling researchers to normalize for game type and player tier. One analysis covering the first five months of 2026 noted that June data continued an established trend: sessions funded by recurring deposit schedules lasted 12 percent longer on average than one-time funding events, regardless of the state where the account originated.
Technical Infrastructure Supporting Pattern Detection
Modern casino networks employ real-time monitoring tools that flag unusual payment sequences, such as rapid deposit-withdrawal cycles or sudden shifts in funding sources. These systems feed into broader analytics platforms that correlate transaction velocity with session endpoints. Operators have adjusted interface designs in response, for instance by surfacing withdrawal options only after a minimum play threshold, which data indicates lengthens average engagement periods. Security protocols also influence flow patterns. Multi-state compliance requires identity verification at multiple points, and each verification step introduces measurable pauses that fragment longer sessions into smaller segments. Platforms that streamline these checks while maintaining regulatory standards demonstrate higher rates of continuous play intervals.
Seasonal and Regional Variations Observed in 2026
Payment behavior shifts with calendar events, and June 2026 data reflected typical early-summer patterns of increased mobile deposits during travel periods. Players crossing state lines for leisure frequently initiate sessions with one state's approved funding method before completing play under another jurisdiction's rules, creating hybrid transaction trails that analysts track through shared player accounts. Regional differences persist because tax structures and responsible gaming limits vary. Markets with higher withdrawal caps show elevated session completion rates, while states enforcing stricter daily deposit ceilings register more frequent but shorter play periods. These distinctions remain visible even when the same operator manages properties on both sides of a border.
Conclusion
Payment flow patterns across multi-state casino networks supply measurable indicators of session duration because every transaction timestamp and method choice leaves a record that aligns with start and end points of play. Regulatory reports, platform analytics, and cross-jurisdictional comparisons continue to supply the raw material for understanding these relationships as operators refine their systems through mid-2026 and beyond.