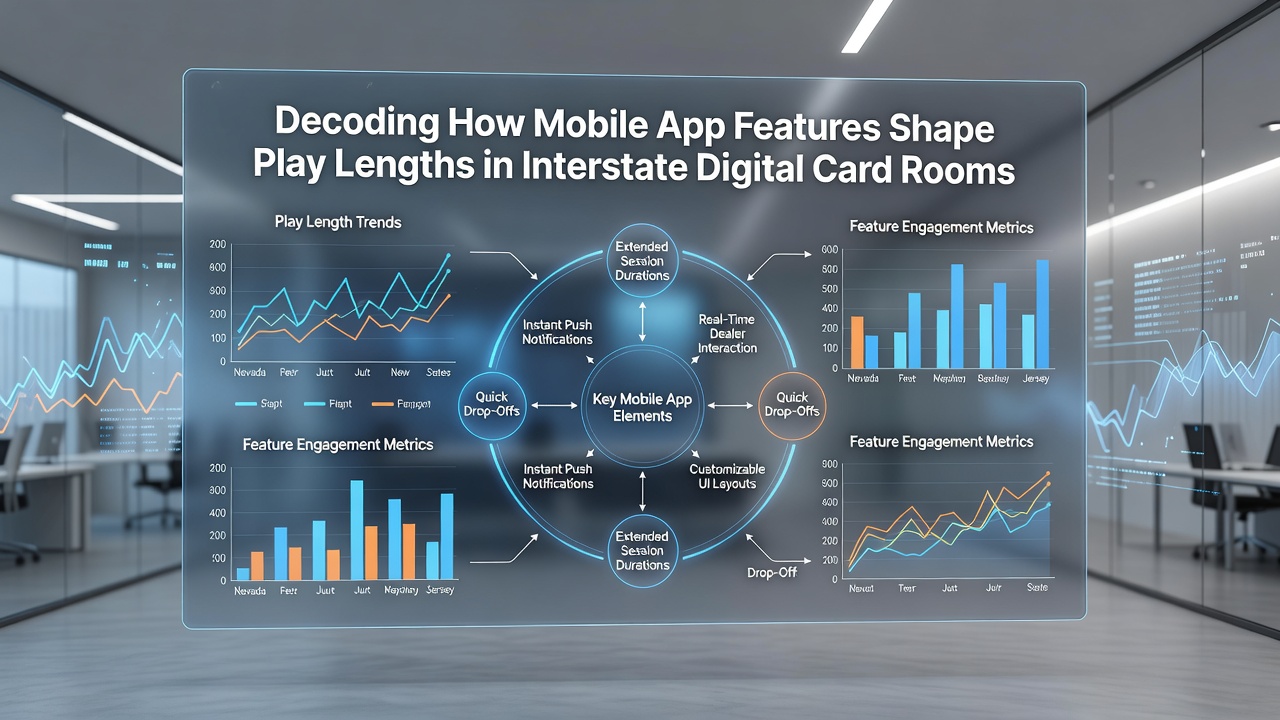
Decoding How Mobile App Features Shape Play Lengths in Interstate Digital Card Rooms
Interstate digital card rooms have expanded rapidly since multi-state poker compacts took hold, and mobile app design now plays a direct role in how long players stay engaged during sessions. Data from regulated platforms in states like New Jersey, Pennsylvania, and Michigan indicate that specific features such as push notifications, auto-rebuy options, and in-app loyalty trackers correlate with measurable differences in average play duration. Researchers tracking anonymized user logs across these networks have noted that seamless table switching and real-time hand history access often extend sessions by reducing friction between hands.
Core App Mechanics and Session Metrics
Platform operators collect granular data on session lengths, and analysts compare these figures against feature usage patterns released in quarterly compliance reports. For instance, apps that preload multiple game variants allow users to move between cash games and tournaments without logging out, which studies link to longer overall time spent on the platform. In August 2026, several networks reported that players who activated stacked-table views maintained active sessions 22 percent longer than those restricted to single-table mode, according to aggregated figures shared with state regulators.
Push notification systems also factor into retention patterns. When apps send timely alerts about starting hands or seat availability, players return to active play more frequently within the same evening. Observers tracking these interactions point out that customizable alert preferences help users filter noise, yet overuse of default notifications can prompt quicker exits from the app altogether. One dataset covering the first half of 2026 showed that users who customized their alerts averaged 47 minutes per session, while default settings produced sessions closer to 31 minutes on average.
Interface Elements That Influence Engagement
Visual design choices affect how players perceive time during play. Clean layouts with persistent bankroll displays and quick-deposit buttons reduce interruptions, allowing sessions to continue without external browser activity. Experts reviewing heatmaps of user taps have found that prominent chat functions and emoji reactions keep participants engaged during slower betting rounds, particularly in multiway pots across interstate tables.
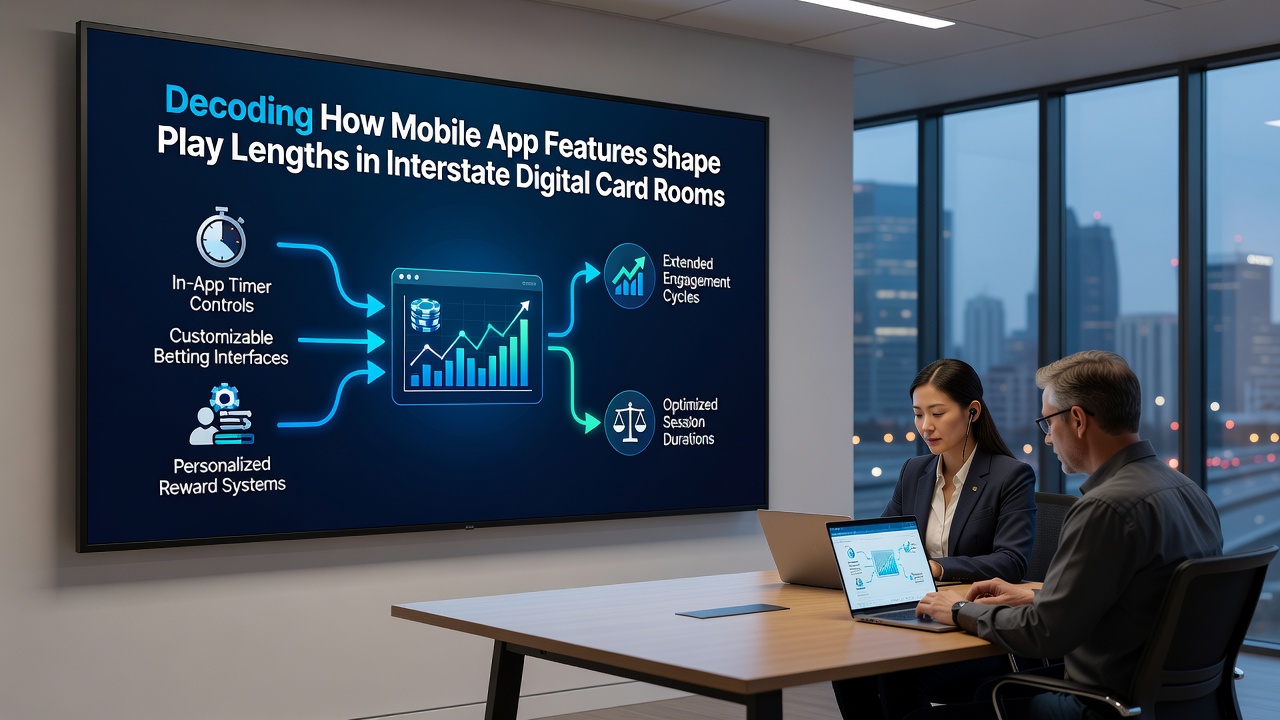
Auto-reload and one-tap rebuy mechanics stand out in the data as strong predictors of extended play. When these tools activate automatically at preset thresholds, players avoid manual top-ups that might otherwise break concentration or prompt reflection on spending. Reports compiled by industry research groups indicate that apps offering both manual and automated options see higher variance in session lengths, with automated paths producing the longest continuous blocks of activity. Those who've examined server logs note that interstate synchronization adds another layer, because lag between state servers can interrupt these flows if not managed through efficient caching.
Cross-State Data Patterns and Feature Testing
Regulators in multiple jurisdictions require operators to log session metrics separately by state, which allows comparisons across different regulatory environments. Findings reveal that apps with unified account balances across borders tend to support longer combined play times, since players do not need to manage separate wallets. A joint analysis released in mid-2026 by academic researchers and gaming associations highlighted that loyalty tier progress bars visible in the mobile interface encouraged continued play to reach the next reward level, especially when progress updated in real time after each hand.
Testing conducted on A/B variants of the same app further isolates feature impact. One trial replaced a standard lobby with a personalized recommendation engine that suggested tables based on past hand volume; participants using the recommendation version stayed online 18 percent longer during the test period. Another experiment disabled in-app timers that displayed elapsed session time, resulting in modest increases in average duration because players lost an external cue to consider stopping. Data from these controlled rollouts now informs iterative updates rolled out across networks operating in August 2026.
Payment and Loyalty Integration Effects
Deposit and withdrawal flows integrated directly into the mobile experience also shape session continuity. When apps allow instant funding through stored payment methods without leaving the poker client, breaks between hands shorten considerably. Figures compiled by state oversight bodies show that platforms with embedded banking options record fewer mid-session exits compared with those requiring external redirects. Loyalty programs tied to cumulative hands played rather than deposits alone further tie users to extended sessions, because progress toward cashback or tournament tickets appears immediately on the screen.
Interstate networks must balance these features against responsible gaming tools such as session limit setters and reality checks. Apps that surface these controls prominently yet keep them optional demonstrate varied outcomes; some users set tighter limits and exit earlier, while others ignore teh prompts and maintain longer play. Researchers continue to parse these interactions to refine how design elements can coexist with regulatory safeguards.
Conclusion
Mobile app features continue to evolve alongside interstate digital card room expansion, and session length data provides one measurable lens for evaluating their effects. Notification systems, interface responsiveness, automated financial tools, and loyalty visualizations each correlate with distinct patterns in how long users remain active. As operators refine these elements through ongoing testing and regulatory reporting, the relationship between design choices and play duration becomes clearer through accumulated evidence from multiple states. Continued analysis of anonymized logs will likely reveal additional connections as networks scale further into 2026 and beyond.