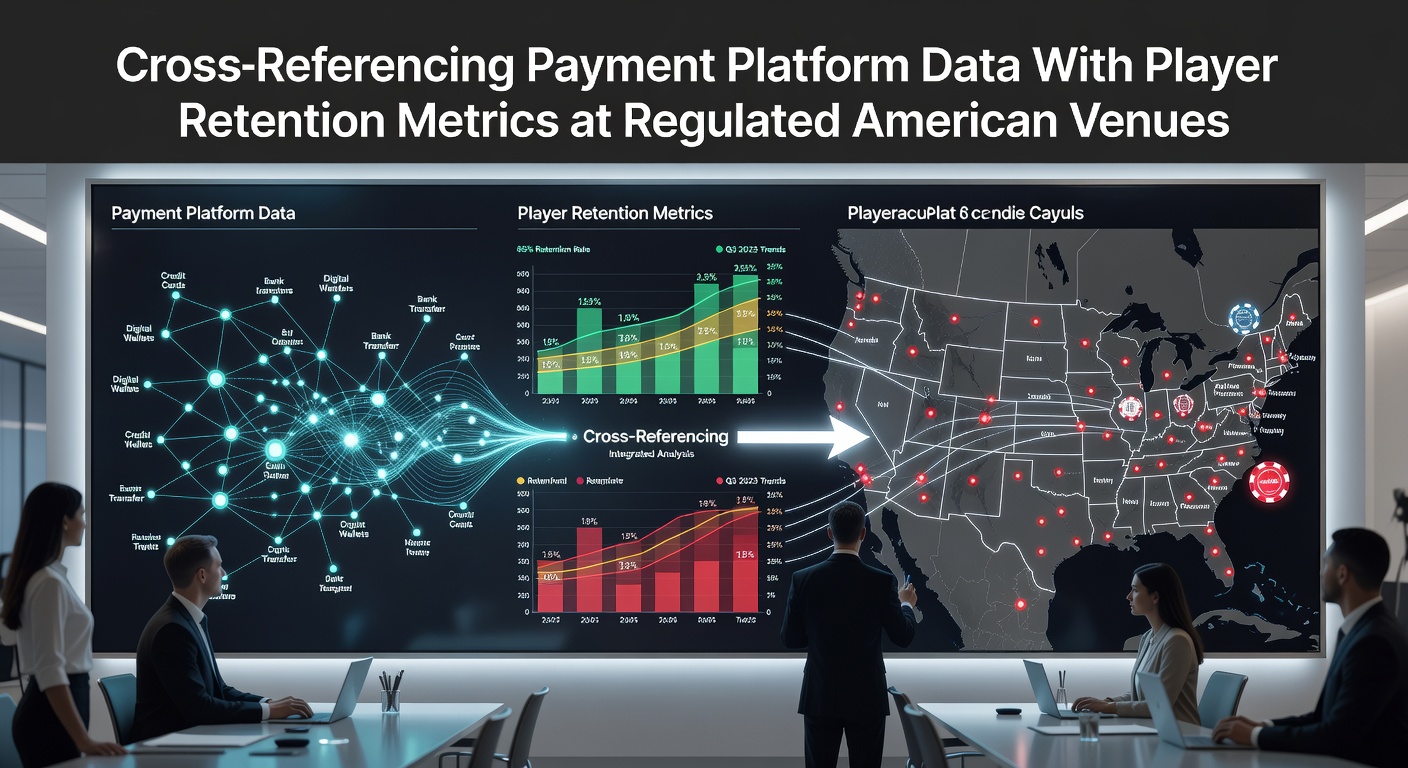
Cross-Referencing Payment Platform Data With Player Retention Metrics at Regulated American Venues
Regulated American venues integrate payment platform data with player retention metrics to track transaction patterns alongside return visits and session durations, and observers note this approach gained traction after multiple states expanded legal frameworks in 2023 and beyond. Payment platforms such as those handling credit cards, e-wallets, and ACH transfers generate records of deposit amounts, withdrawal frequencies, and average transaction values, while retention metrics capture repeat visit rates, average time between sessions, and churn indicators at properties in New Jersey, Pennsylvania, Nevada, and tribal jurisdictions.
Analysts combine these datasets through centralized customer relationship management systems that assign unique identifiers to accounts, allowing correlation of spending velocity with loyalty program activity. Data from the American Gaming Association shows integrated tracking covers millions of active player profiles across commercial and tribal floors, and researchers at institutions like the University of Nevada have examined how such linkages reveal connections between payment method preferences and long-term engagement levels.
Payment Platforms Operating in Regulated Markets
Venues accept a range of processors compliant with state and federal rules, including major card networks, digital wallets, and bank transfers that route through licensed gateways. In New Jersey and Pennsylvania, platforms must meet Division of Gaming Enforcement standards for security and reporting, which produces timestamped logs of every funded session. These logs feed into retention models that calculate metrics like days since last deposit or frequency of high-value transactions, and the process operates under oversight from bodies such as the Nevada Gaming Control Board that require audit trails for all financial activity.
Cross-referencing begins when operators match payment timestamps with entry and exit data from player tracking systems, creating views of how deposit size correlates with length of play. Studies conducted through academic partnerships have mapped these relationships across thousands of accounts, revealing patterns where certain payment types align with higher return rates at specific properties.
Retention Metrics and Data Integration Methods
Retention metrics include visit frequency, average revenue per user over 30- or 90-day windows, and segmentation by recency and monetary value, while payment data supplies the granular transaction history that refines those segments. Software platforms used by operators merge these streams into dashboards that flag accounts showing declining activity despite steady prior funding, and such flags trigger automated communications or offers calibrated to historical spend. In June 2026, several tribal resorts in the Midwest reported deploying updated integration layers that pull real-time payment feeds into retention scoring algorithms already running on loyalty databases.

One documented workflow involves exporting anonymized payment summaries and overlaying them onto heat maps of floor traffic, which allows managers to identify whether players using specific funding methods cluster around particular game types or time slots. Regulatory filings from Pennsylvania casinos indicate that these combined datasets support compliance reporting on responsible gaming limits, since transaction velocity can signal when an account approaches self-imposed thresholds.
Applications Across Jurisdictions
Commercial casinos in Atlantic City have applied the method to compare online and retail player cohorts, matching digital wallet deposits with on-site visit logs to measure how cross-channel behavior affects retention curves. Tribal venues in states such as Oklahoma and California use similar matching to evaluate the impact of cashless kiosks on return frequency, since these systems record every funding event with player card swipes. The resulting datasets feed quarterly reports submitted to state regulators, providing aggregate statistics on payment mix and retention without disclosing individual identities.
Researchers have published analyses showing that accounts with consistent payment patterns across multiple channels exhibit different retention trajectories than those limited to single-method usage, and these findings draw from de-identified records shared under academic data-use agreements. Venues adjust marketing calendars based on these insights, timing promotions to periods when payment data indicates elevated risk of reduced activity.
Regulatory and Technical Considerations
State laws require that any cross-referencing respects data minimization principles and maintains separation between personally identifiable information and aggregated analytics, and operators must obtain explicit consent for loyalty-linked tracking in most jurisdictions. Technical implementations rely on secure APIs that pull payment records into analytics environments hosted within casino-controlled servers, with encryption standards matching those mandated by the New Jersey Division of Gaming Enforcement and comparable agencies elsewhere. In June 2026, updates to reporting templates in several states began requesting summary statistics on payment-retention correlations as part of routine market health assessments.
Industry groups such as the National Council on Problem Gambling have referenced these integrated datasets when developing voluntary standards for early-intervention triggers, noting that transaction velocity combined with visit gaps can highlight accounts requiring additional resources. The technical architecture continues to evolve as new payment rails, including instant bank transfers, enter regulated markets and add fresh data points to existing retention models.
Conclusion
Cross-referencing payment platform data with player retention metrics supplies regulated American venues with structured views of financial activity and engagement patterns that support operational decisions and regulatory compliance. The practice draws on established data sources from commercial and tribal properties, relies on secure integration methods, and produces aggregate insights used in filings and academic studies. As payment options expand and retention tracking systems advance, the combined datasets remain a core component of analytics programs across multiple jurisdictions.