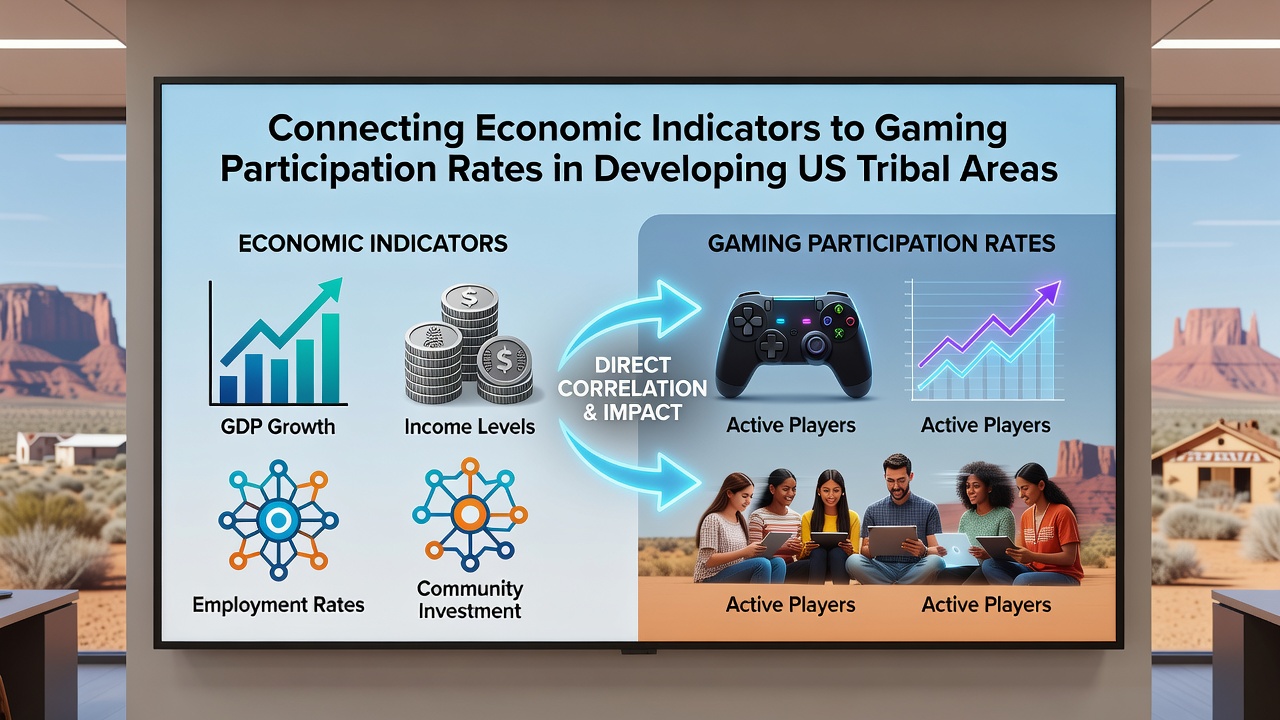
Connecting Economic Indicators to Gaming Participation Rates in Developing US Tribal Areas
Observers note that economic indicators such as unemployment rates, median household income levels, and poverty percentages often align with shifts in gaming participation across developing US tribal areas where casino operations have expanded over the past decade. Researchers track these connections through data from federal agencies and tribal reports, revealing how local job markets and income distributions influence visitor numbers and player engagement at reservation-based facilities.
Economic Indicators Shaping Tribal Regions
Data from the US Census Bureau shows unemployment in many tribal communities hovering between 10 and 25 percent during 2025, with several developing areas reporting gradual declines as casino projects create construction and hospitality positions. Median household incomes in these zones frequently range from $35,000 to $55,000 annually, figures that correlate with participation spikes when new gaming venues open and provide entry-level roles that reduce reliance on external employment.
Those who've examined Bureau of Labor Statistics releases find poverty rates above 25 percent in numerous tribal counties, yet these same locations demonstrate measurable increases in gaming foot traffic once facilities reach operational status and distribute wages that circulate within reservation economies. What's interesting emerges when analysts cross-reference per capita income growth against slot machine utilization and table game occupancy rates collected by state gaming commissions.
Gaming Participation Patterns and Data Sources
Participation rates at tribal casinos reflect visitor counts, session durations, and loyalty program sign-ups, metrics compiled by the National Indian Gaming Commission and individual tribal gaming offices. In developing areas where infrastructure improvements coincide with casino launches, daily attendance figures have climbed between 15 and 30 percent year-over-year according to aggregated industry summaries released through mid-2026.
Studies from the University of Arizona's Native Nations Institute indicate that counties with falling unemployment also post higher rates of repeat visits, particularly among local tribal members who gain disposable income through casino-related jobs. These patterns hold across multiple jurisdictions where facilities target regional markets rather than relying solely on tourist draw.
Linking Indicators to Participation Trends
Correlations surface when researchers map income growth against gaming revenue per capita, showing that a 5 percent rise in median earnings often precedes a corresponding lift in player hours logged at facilities. Economic development grants and federal programs aimed at tribal infrastructure further support these links by improving road access and broadband connectivity that facilitate both employment and leisure travel to casinos.
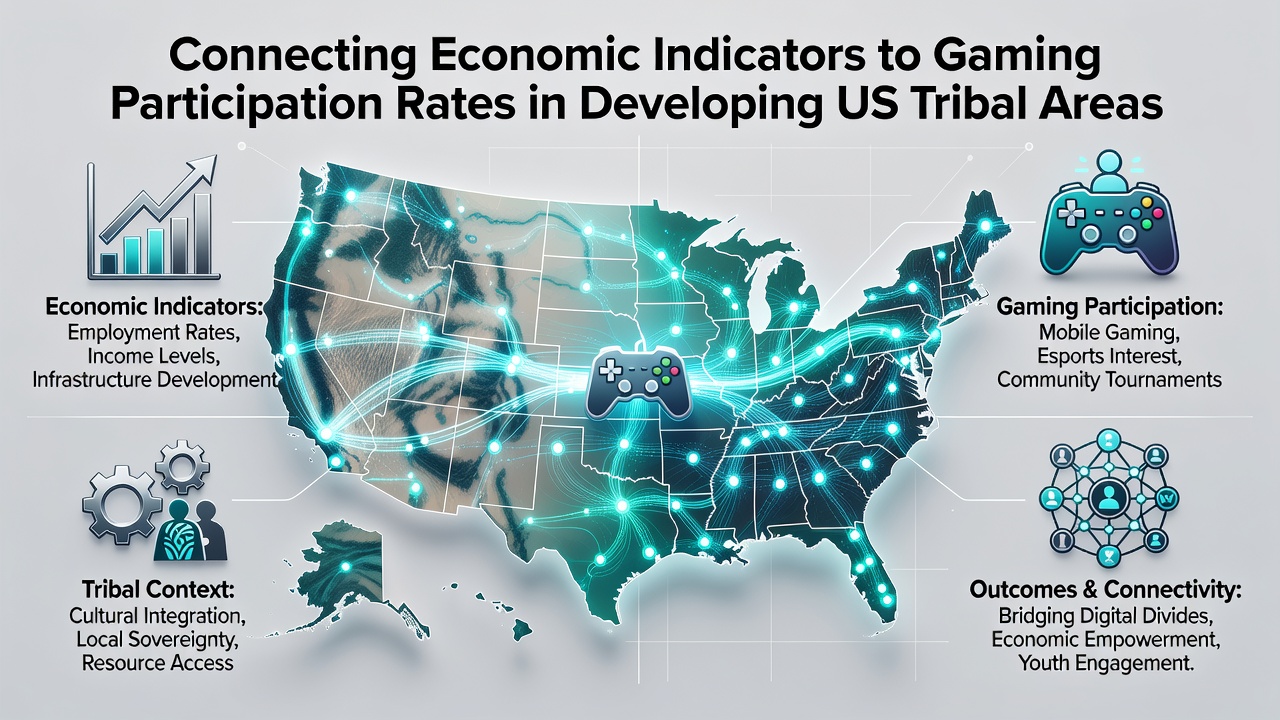
But here's the thing: participation does not move uniformly, as areas with persistent high poverty sometimes experience slower uptake even after casino openings because transportation barriers and competing household expenses limit discretionary spending. Analysts adjust models to account for these variables by incorporating housing cost indices and public assistance enrollment numbers alongside traditional gaming metrics.
Developments Observed Through July 2026
July 2026 data releases from tribal economic development offices highlight several regions where unemployment dipped below 12 percent while gaming participation metrics advanced at comparable paces. Facilities in the Midwest and Southwest reported session length increases averaging 22 minutes per player when local wage growth exceeded national averages, according to internal tracking shared with regulatory partners.
Observers note that seasonal employment patterns tied to tourism and agriculture continue to modulate these relationships, producing predictable dips during winter months that reverse once construction and service sector jobs rebound. Cross-referencing these cycles with loyalty card redemption rates provides clearer pictures of how economic stability sustains longer-term engagement.
Conclusion
Evidence assembled from government statistical agencies and tribal oversight bodies demonstrates consistent though variable connections between economic indicators and gaming participation rates across developing US tribal areas. Continued monitoring of income, employment, and poverty metrics alongside operational data from casino floors offers a factual basis for understanding participation dynamics without assuming uniform outcomes across every community.