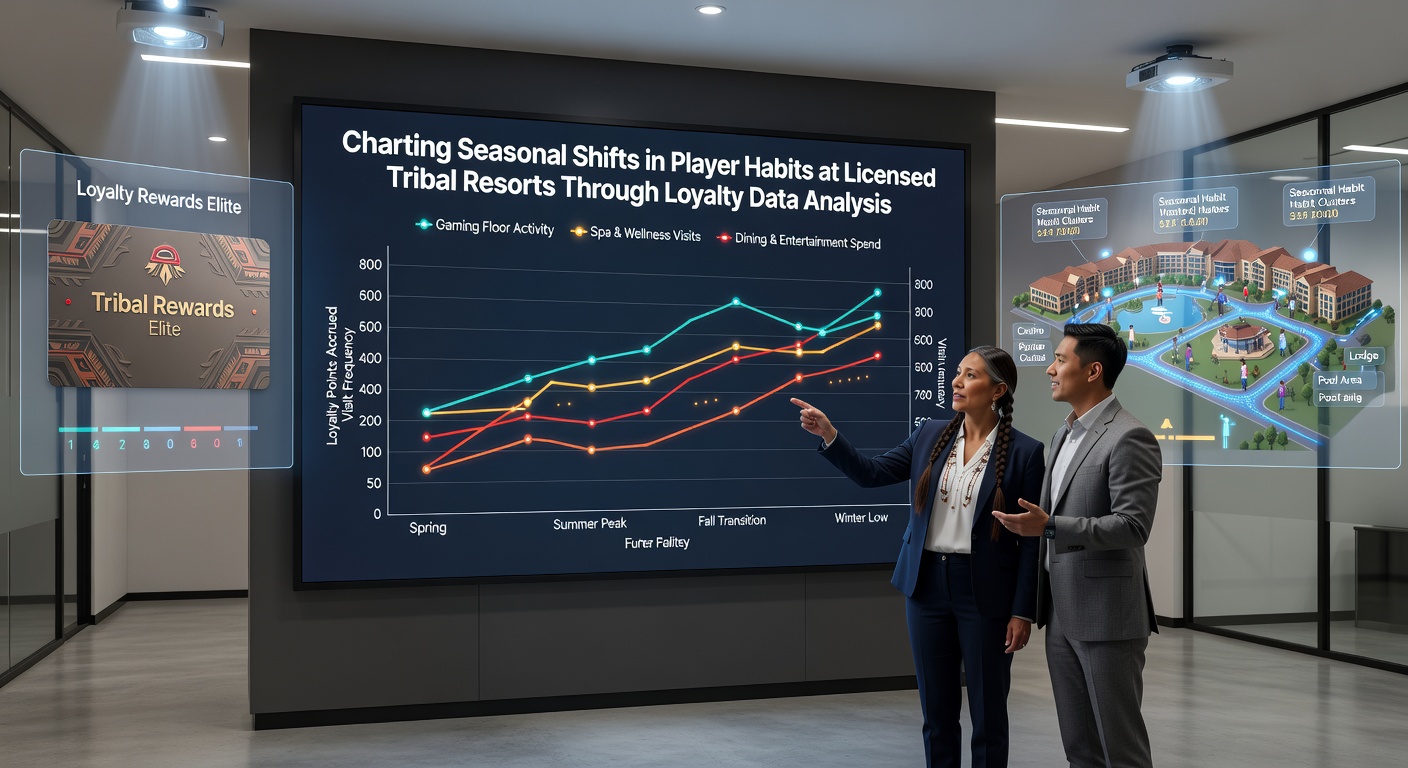
Charting Seasonal Shifts in Player Habits at Licensed Tribal Resorts Through Loyalty Data Analysis
Analysts at several licensed tribal resorts across the United States have turned to loyalty program databases to track how visitor patterns evolve throughout the year, and the numbers reveal clear cycles tied to weather, holidays, and regional events. Data collected from carded players at properties in Oklahoma, California, and the Pacific Northwest shows measurable changes in visit frequency, game preferences, and spend per trip that align with calendar quarters rather than random fluctuations.
How Loyalty Systems Capture Behavioral Changes
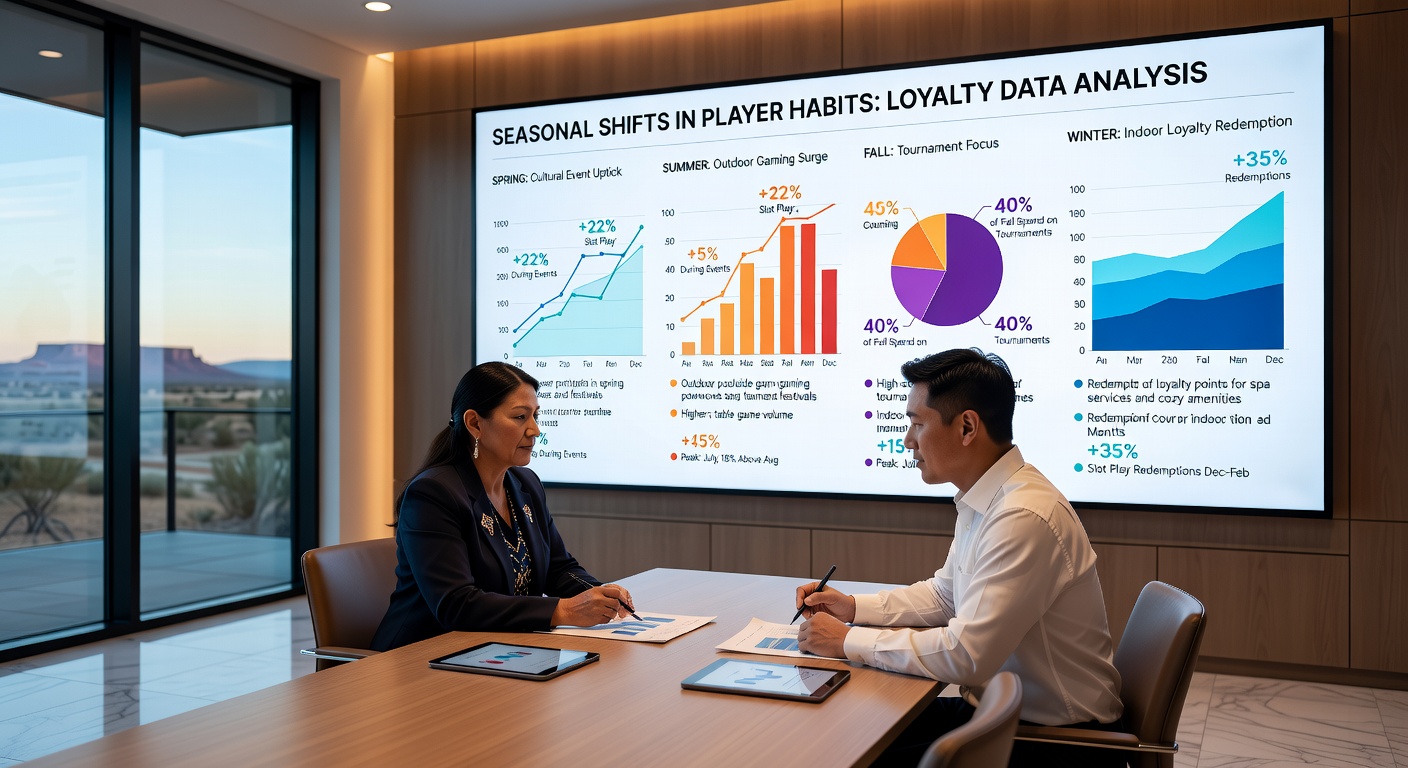
Tribal gaming operations maintain detailed records through player rewards cards that log every slot pull, table game decision, and dining transaction, which creates a rich dataset for seasonal comparison. When teams aggregate this information over multiple years they notice that average session lengths stretch during summer months while midweek visits drop in favor of weekend clusters, patterns that repeat across different properties despite variations in local climates. In May 2026 analysts reviewing twelve-month loyalty extracts observed a 14 percent rise in family-oriented reward redemptions compared with the prior spring, coinciding with school breaks and improved highway travel conditions.
Documented Patterns Across Quarters
Spring data typically shows a gradual uptick in new card sign-ups as tourists begin planning getaways, whereas summer months bring higher volumes of multi-day stays and elevated use of resort amenities beyond the gaming floor. Fall periods register steadier but lower daily foot traffic, with loyalty metrics indicating a shift toward higher-limit table games among regular cardholders who return for shorter, more focused sessions. Winter figures often spike around major holidays, yet they also reveal dips during severe weather events that deter drive-up visitors from neighboring states.
Researchers examining these trends note that slot machine denomination preferences move toward higher-stakes options during peak vacation windows, while lower-denomination games retain steady play from local cardholders year-round. Food and beverage redemptions follow a similar rhythm, climbing sharply before Thanksgiving and again in late December before settling into routine levels by late January.
Regional Differences Emerge From the Same Datasets
Properties located near major population centers record different seasonal signatures than those situated in more remote resort settings. Oklahoma facilities, for instance, display pronounced weekend surges in spring and fall that correspond with regional festivals, while California tribal resorts see steadier weekday traffic from retirees during winter months when coastal weather remains mild. Pacific Northwest locations note a distinct summer peak tied to outdoor recreation packages bundled with gaming credits, a feature less prominent in desert-region properties where extreme heat shifts activity toward indoor evenings.
Operational Adjustments Driven by the Numbers
Resort managers use these loyalty-derived insights to adjust staffing rosters, marketing calendars, and floor layouts months in advance. When summer data consistently signals increased demand for family entertainment zones, properties expand kids' activity offerings and schedule more frequent bus promotions aimed at group travelers. Winter analyses prompt targeted offers for overnight packages that include heated parking and shuttle services, addressing barriers that appear in the visit-frequency logs. Marketing teams also time direct-mail campaigns and app notifications to align with the quarters when specific player segments show highest responsiveness, measured through redemption rates tracked in the same loyalty systems.
According to reports from the National Indian Gaming Commission, tribal operators increasingly integrate these seasonal loyalty metrics into annual budgeting processes. The commission's aggregated compliance data indicates that properties employing data-driven scheduling maintain more consistent revenue streams across quarters compared with those relying on historical averages alone.
Case Examples From Multiple Markets
One Midwest tribal resort tracked a three-year rise in spring golf-package redemptions that prompted construction of an additional nine-hole short course opened in 2025, and subsequent loyalty data showed a corresponding 9 percent increase in midweek overnight stays. Another operator in the Southwest documented a winter decline in high-limit room bookings that led to a revised comp structure favoring slot tournament entries instead, which stabilized card activity during the slowest months. Observers note that these adjustments appear in the metrics within one or two seasons, demonstrating the feedback loop between analysis and operational response.
Academic and Industry Perspectives
A study published by researchers at the University of Nevada, Reno examined loyalty records from five tribal properties and confirmed that seasonal shifts in game-type selection remain consistent even after controlling for promotional spend. The paper highlighted how shoulder-season incentives can flatten revenue curves when calibrated to the specific behavioral clusters identified in the data. Industry associations such as the National Indian Gaming Association have hosted workshops where analysts share anonymized seasonal benchmarks, allowing smaller operations to compare their figures against larger peers without disclosing proprietary details.
Conclusion
Loyalty data analysis supplies tribal resorts with a factual basis for anticipating and responding to recurring player-habit cycles, from summer family surges to winter holiday spikes. As more properties refine their data collection and integrate external variables such as weather forecasts and regional event calendars, the precision of these seasonal models continues to improve. The resulting operational decisions support steadier performance across all quarters while maintaining compliance standards set by regulatory bodies.